Recovery Score Meaning
Recovery scores combine HRV, sleep and resting heart rate signals.
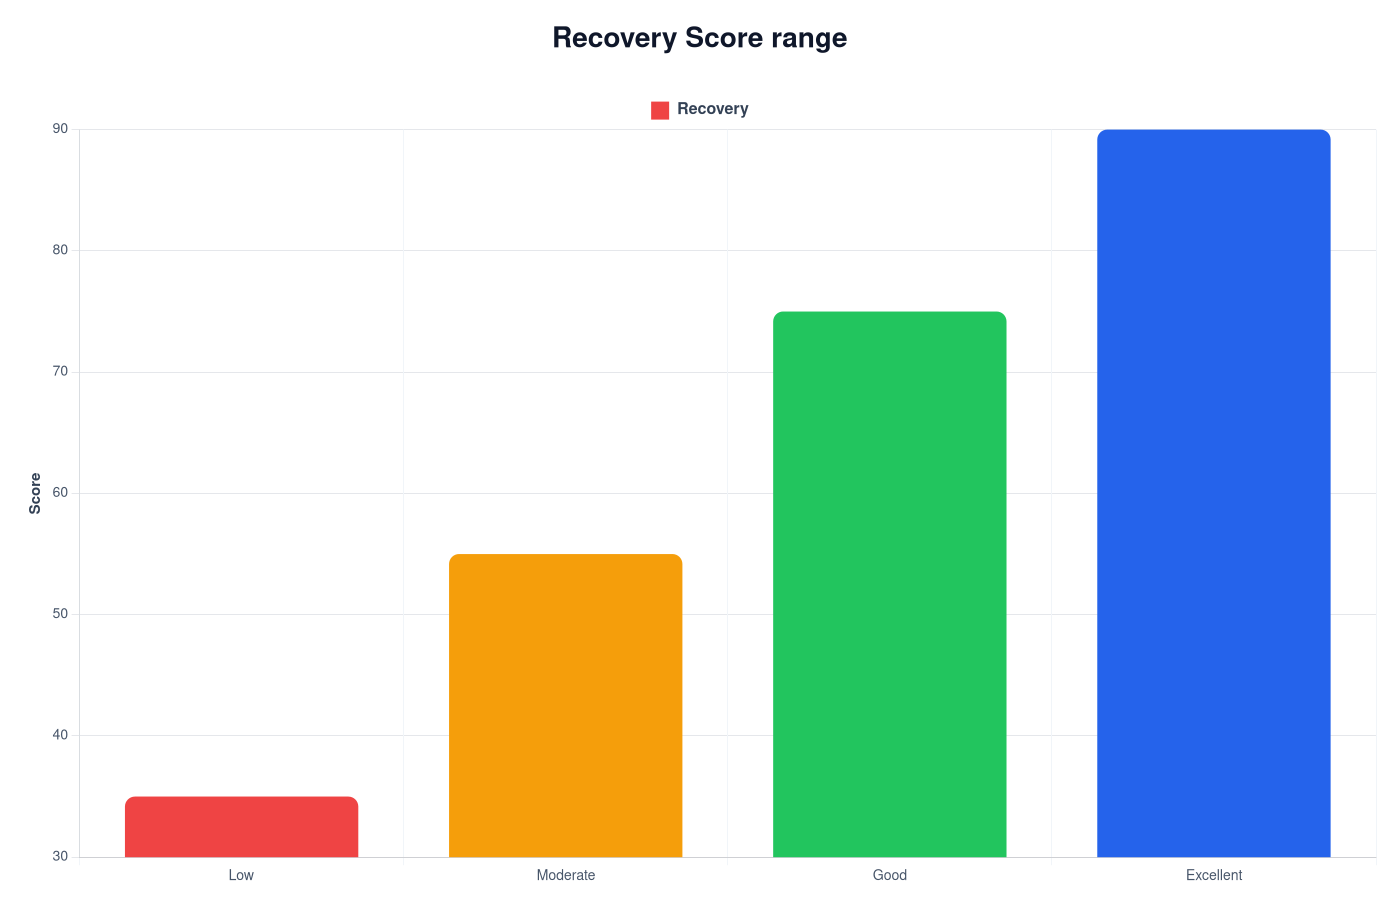
Visualization
How to Read This Chart
This chart helps put Recovery Score into context. Instead of looking at one isolated number, you can see whether a value is relatively low, typical or high.
Typical Values
| Score | Meaning |
|---|---|
| 90–100 | Fully recovered |
| 80–89 | Good recovery |
| 70–79 | Moderate recovery |
| 60–69 | Low recovery |
| Below 60 | Very low recovery |
What This Chart Means in Practice
A chart becomes useful when you want to understand:
- whether your value is in a common range
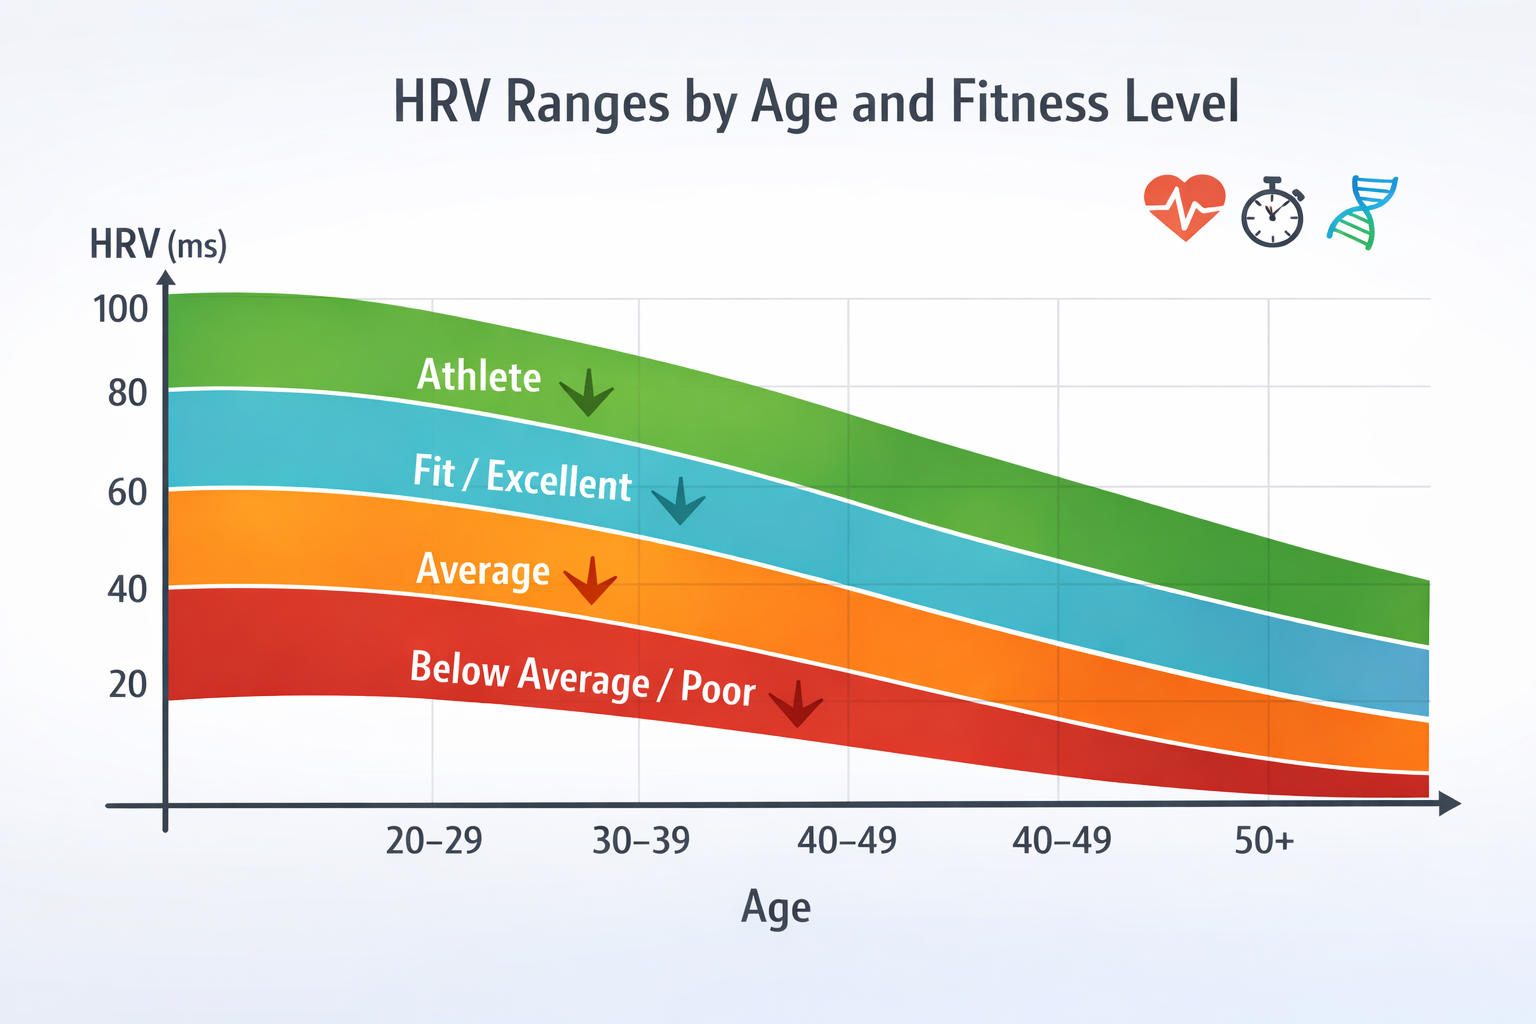
- how values change with age or load
- whether your wearable data looks plausible
- which factors may move your value up or down
Key Factors Behind the Chart
When interpreting this chart, consider:
- age
- sex
- training status
- sleep and recovery
- stress and lifestyle
Practical Use
Do not use this chart only once. It is most useful for:
- weekly and monthly trends
- interpreting outliers
- comparing sleep, stress and recovery data
- making better training and recovery decisions
Useful Internal Links
Recommended RECOVERY Trackers
Understand Your Health Data
LongLife Scan analyzes wearable health data and helps you understand patterns in stress, sleep and recovery.
Try LongLife ScanRelated Metrics
Health Metrics
Overview of wearable health metrics including HRV, VO2max, sleep and recovery.
View Metric →
Related Charts
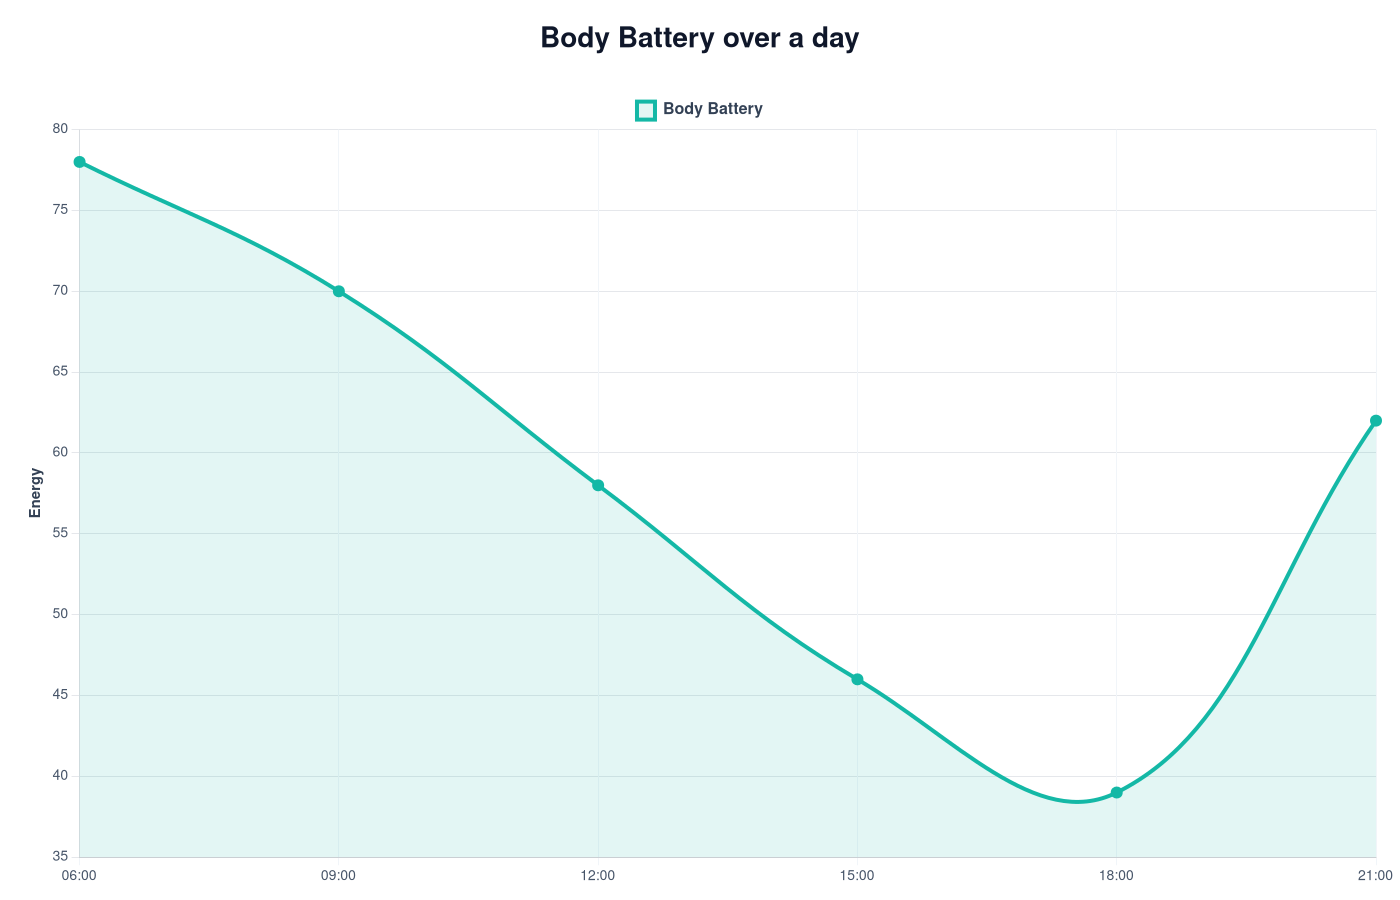
Body Battery Chart
Body Battery charts show how wearable devices estimate energy, recovery and stress patterns during the day.
View Chart →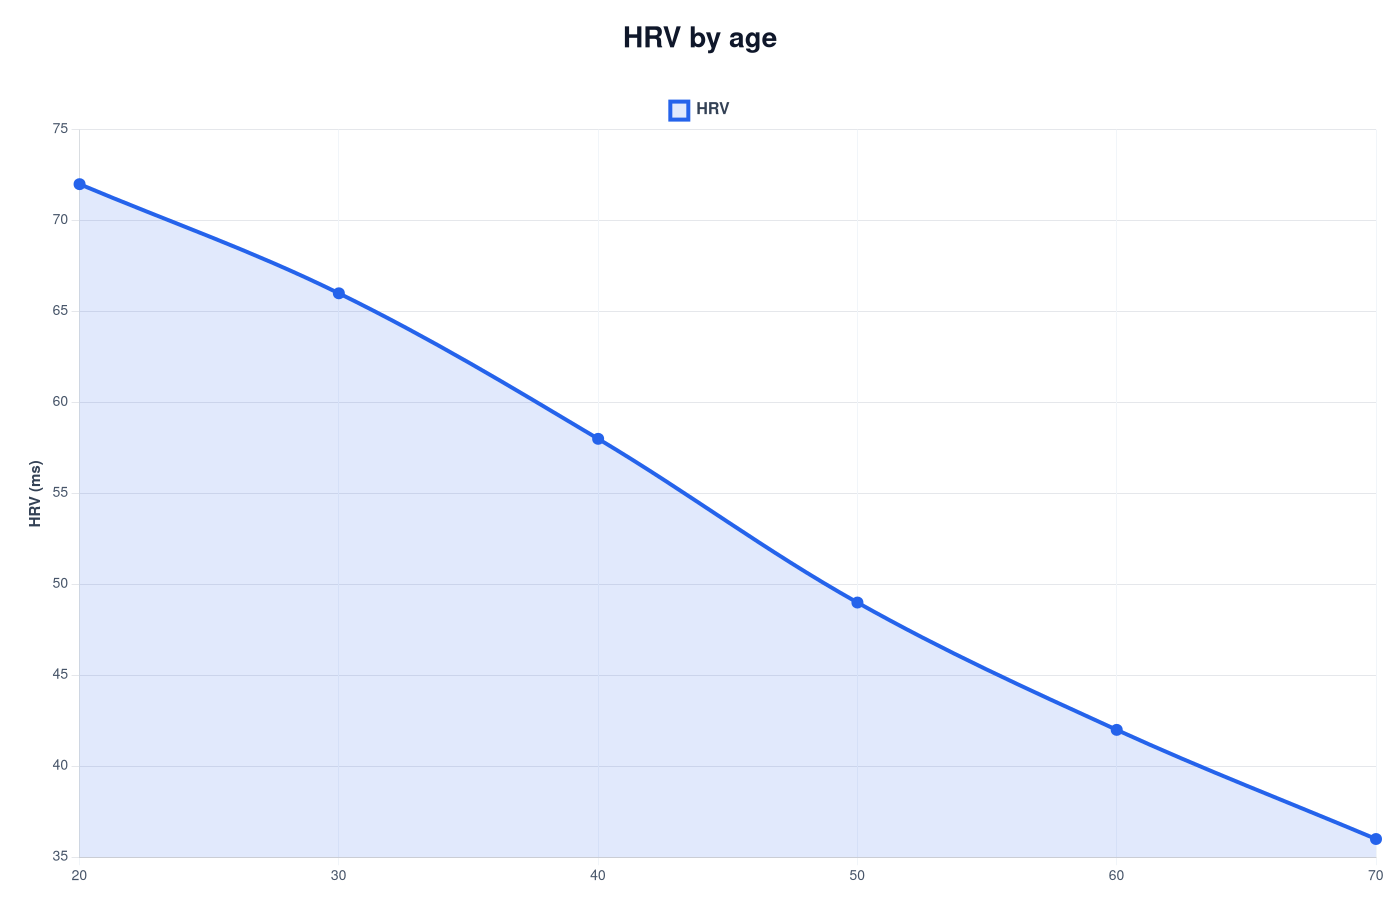
HRV Chart – Typical Heart Rate Variability Ranges
HRV trends show recovery and stress patterns over time.
View Chart →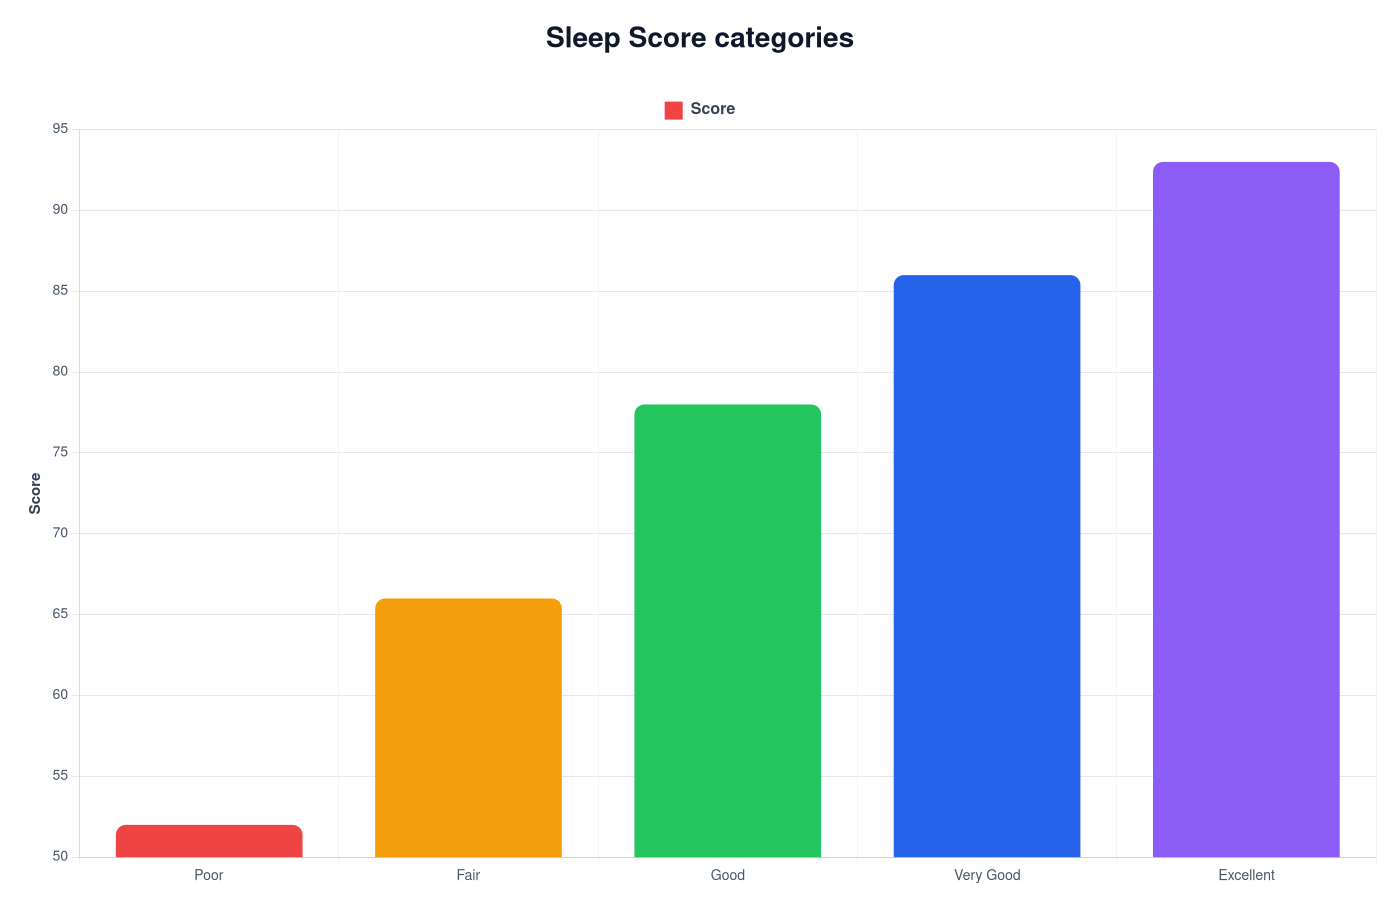
Sleep Score Chart – Sleep Quality Explained
Sleep score charts show typical score ranges and help interpret wearable sleep quality estimates.
View Chart →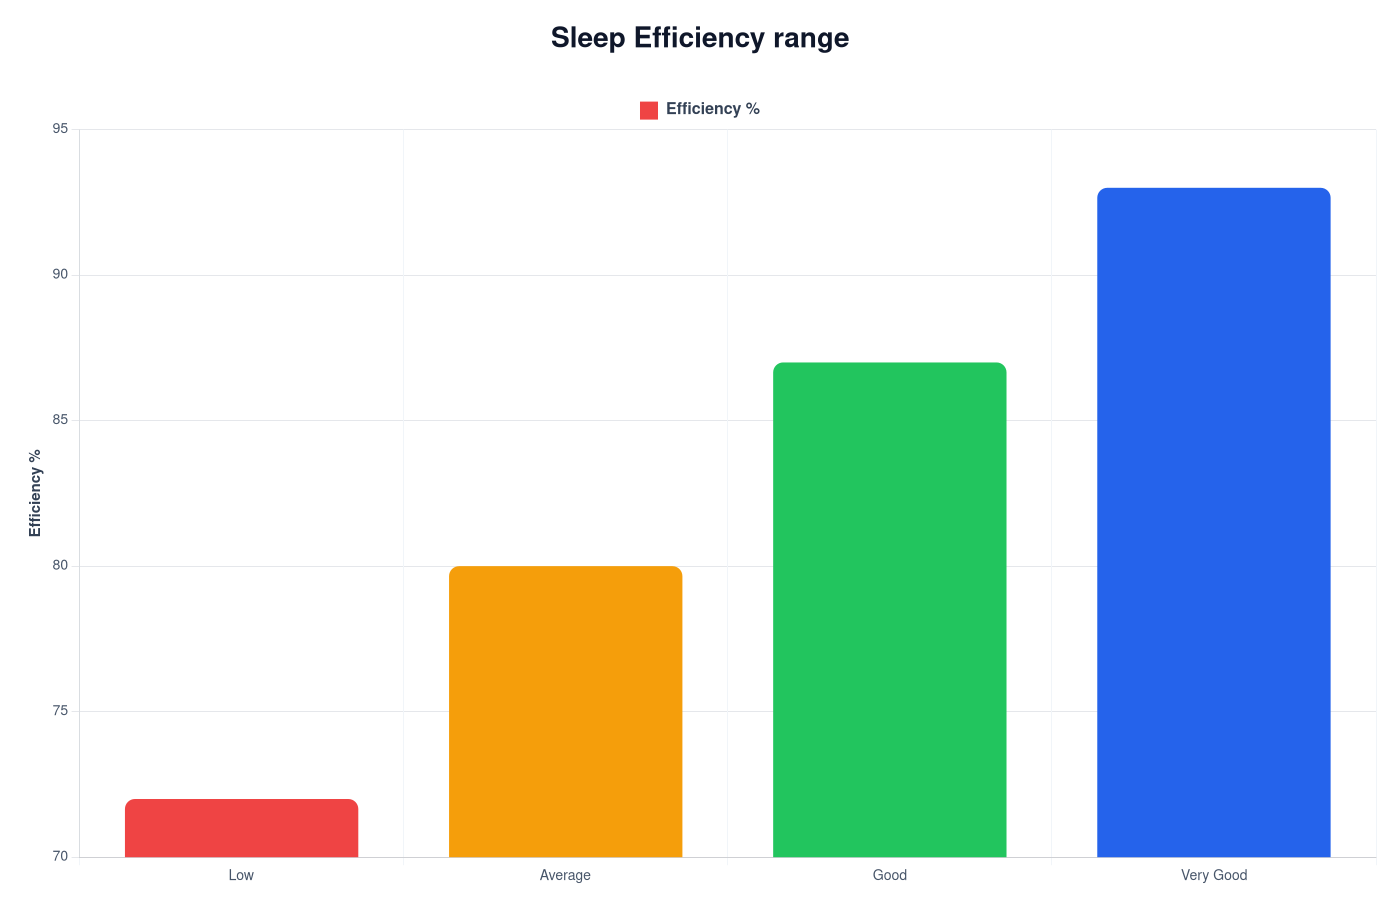
Sleep Efficiency Chart
Sleep efficiency charts show how much of your time in bed is spent sleeping and help interpret sleep continuity.
View Chart →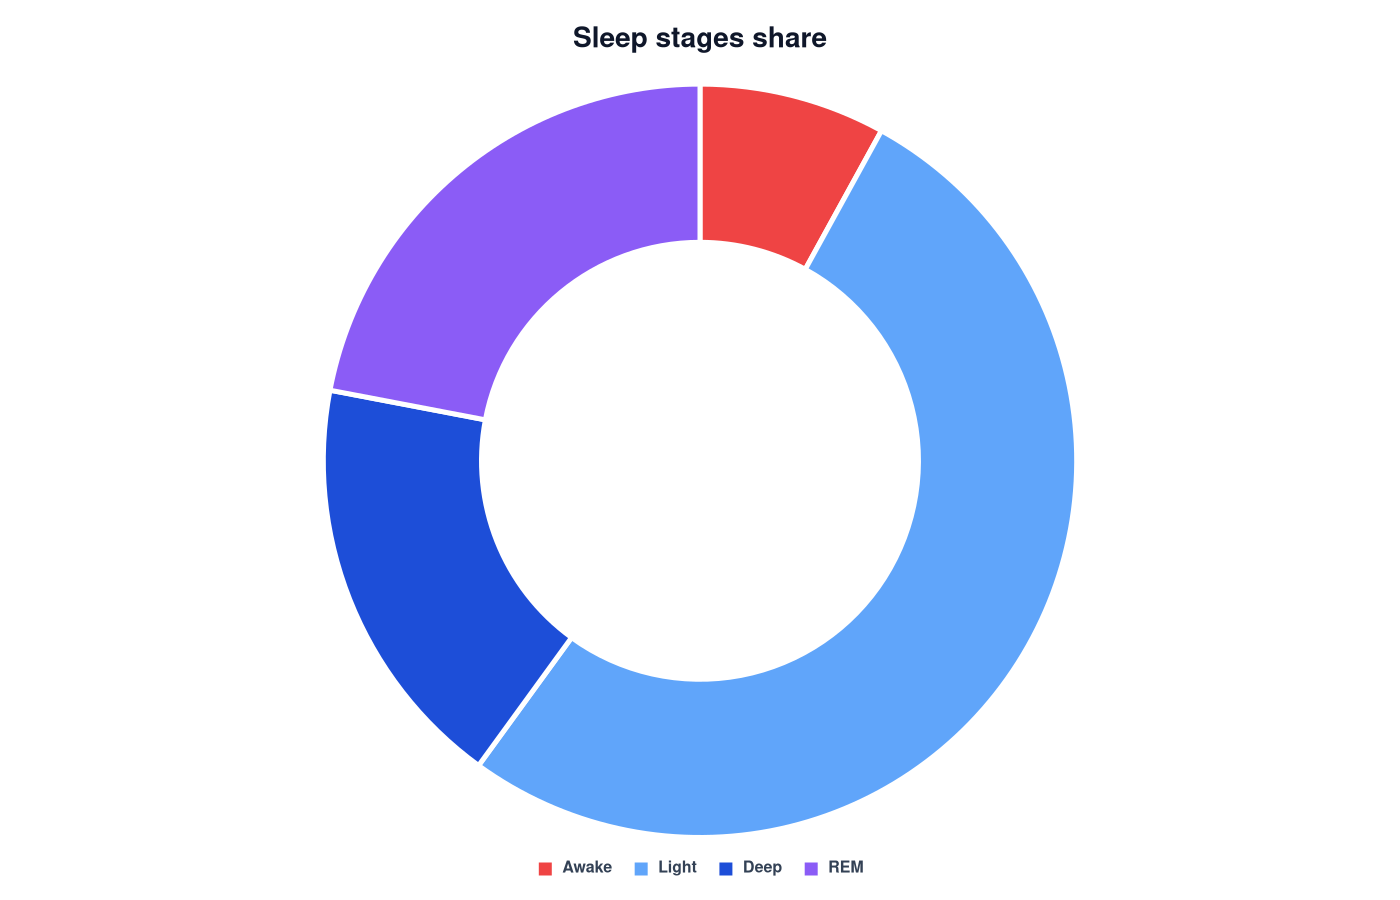
Sleep Stages Chart
Sleep stages charts show how sleep cycles are distributed between light sleep, deep sleep and REM sleep.
View Chart →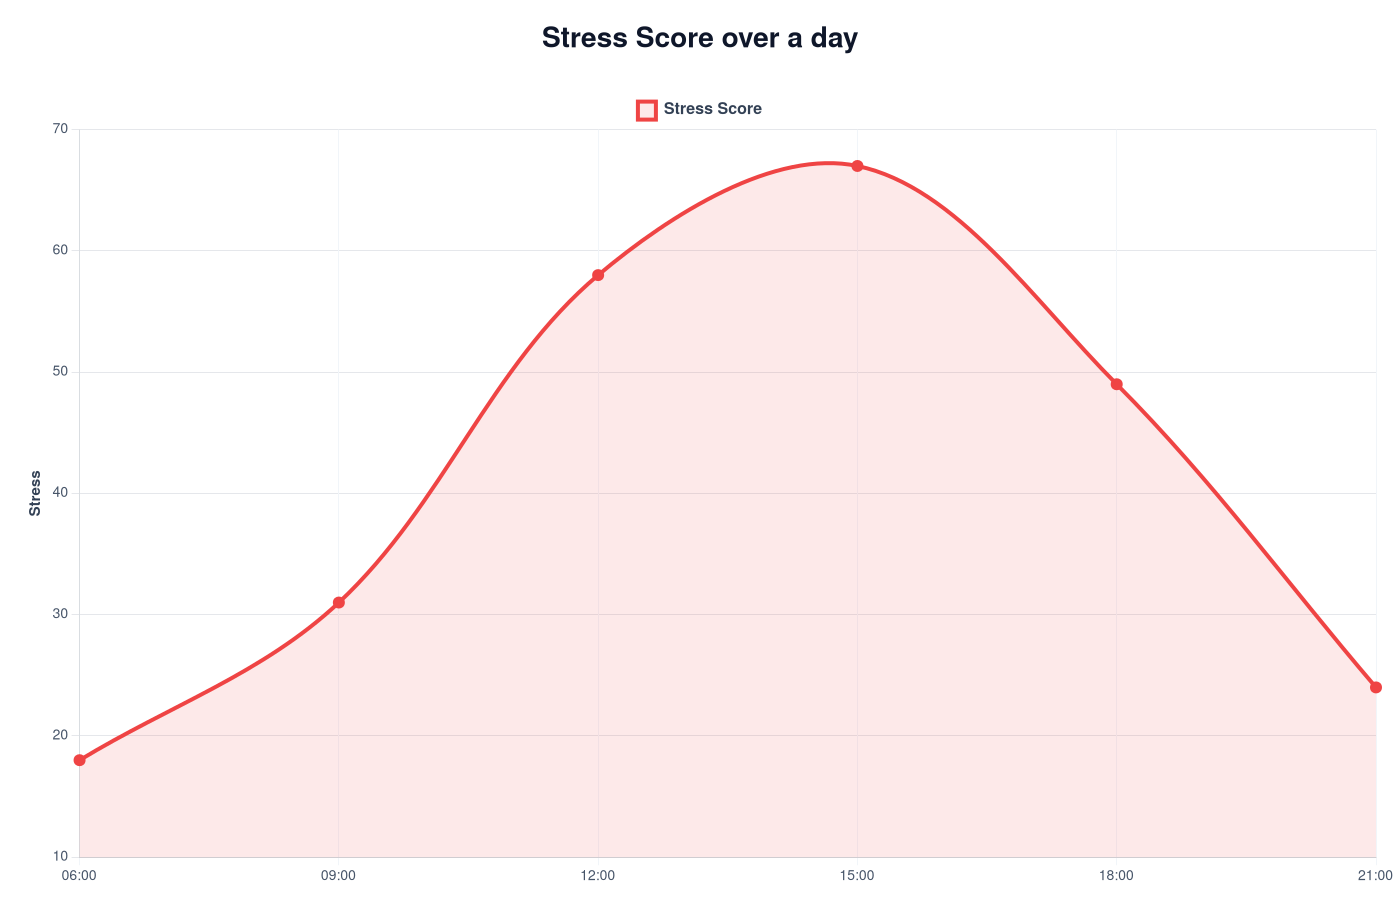
Stress Score Chart
Stress score charts show typical stress ranges and help interpret wearable physiological stress signals.
View Chart →