
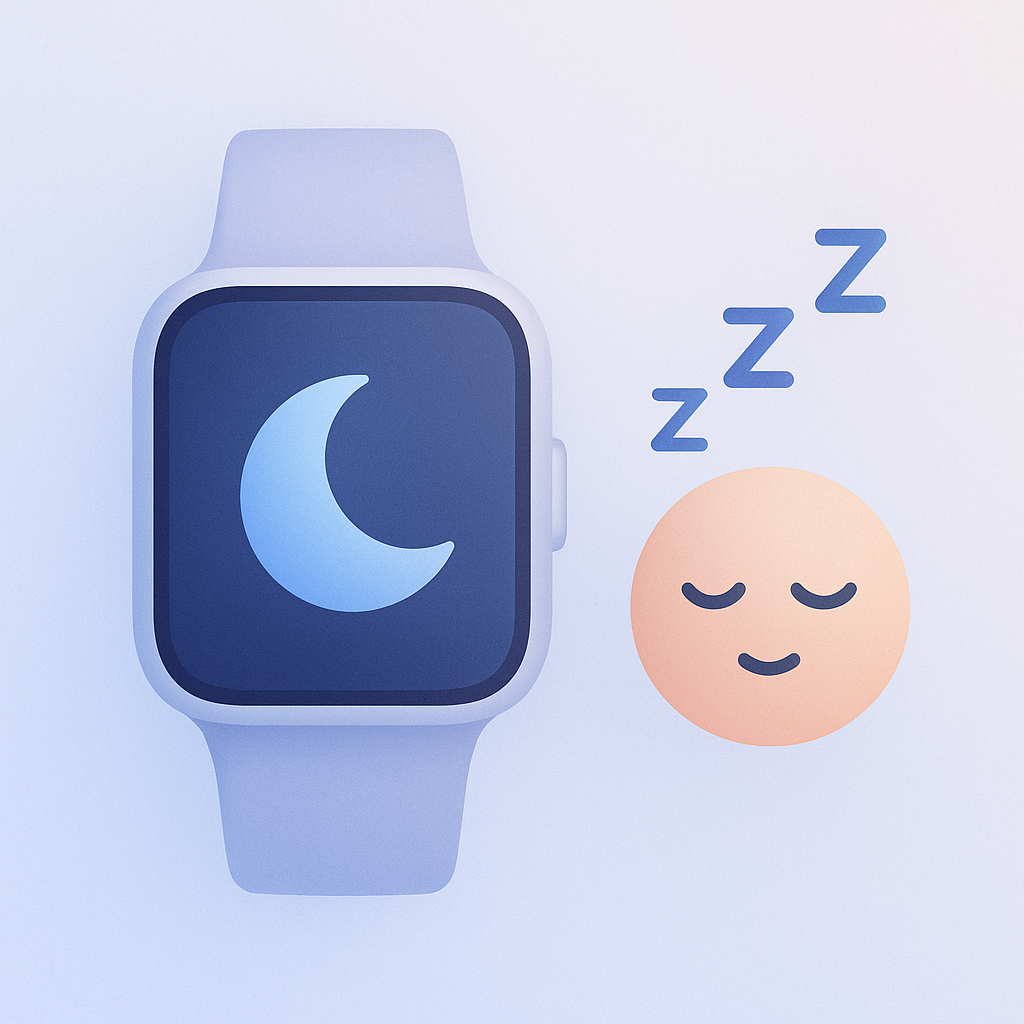
Typical sleep efficiency ranges
- Above 90% — very efficient sleep
- 85–90% — normal sleep efficiency
- Below 85% — possible fragmented sleep
See the Sleep Efficiency Chart.
What affects sleep efficiency
Sleep efficiency can be influenced by sleep quality, nighttime awakenings, stress and overall sleep habits.
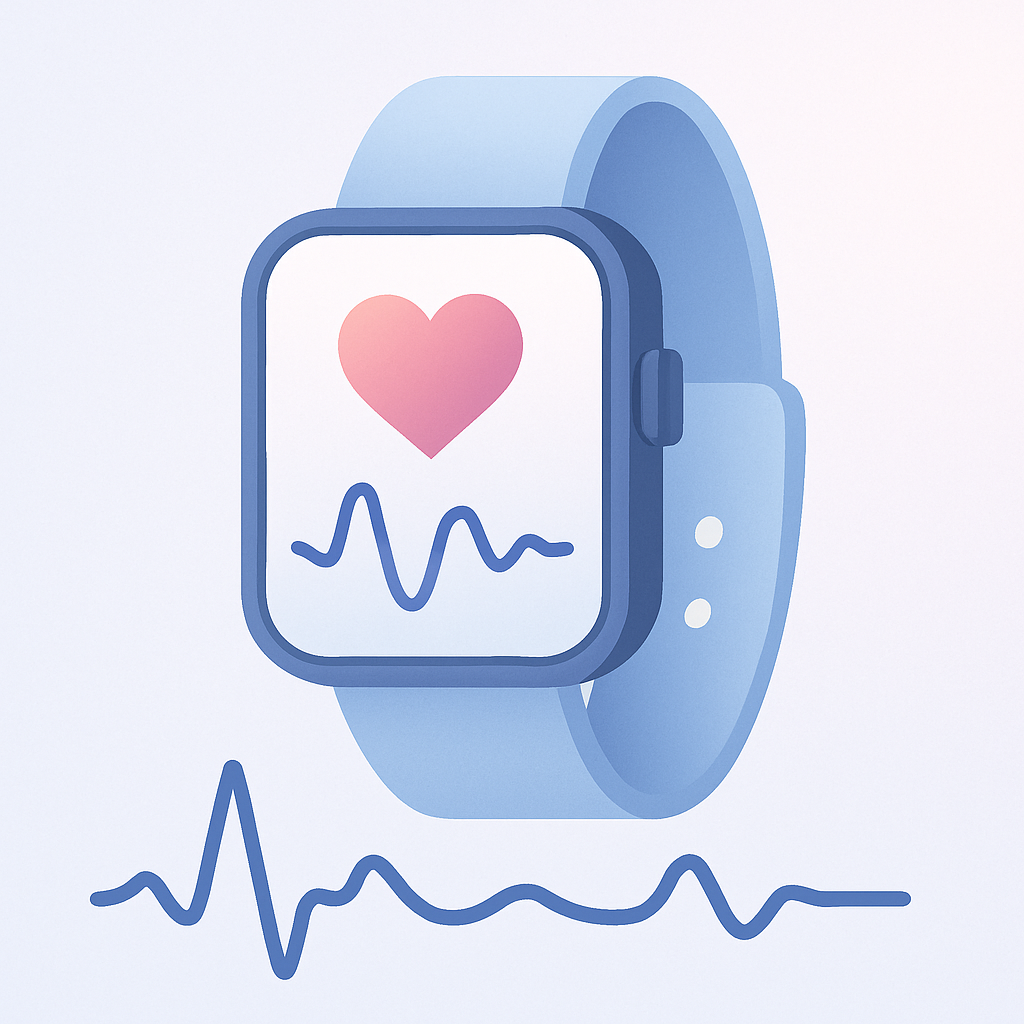
How wearables estimate sleep efficiency
Wearables estimate sleep efficiency using motion data, heart rate and sleep detection algorithms.
Learn more about sleep metrics.
What Counts as a Normal Range
A normal range for Sleep Efficiency depends on age, sex, training status and measurement method.
Typical Reference Values
| Sleep Efficiency | Interpretation |
|---|---|
| 90–100% | Excellent |
| 85–89% | Good |
| 80–84% | Moderate |
| Below 80% | Low |
How to Use a Normal Range Correctly
A normal range is not a fixed target. It mainly helps you:
- interpret unusually low or high values
- understand your wearable data better
- evaluate changes over time more sensibly
Useful Internal Links
Recommended SLEEP Trackers
Understand Your Health Data
LongLife Scan analyzes wearable health data and helps you understand patterns in stress, sleep and recovery.
Try LongLife ScanRelated Metrics
Health Metrics
Overview of wearable health metrics including HRV, VO2max, sleep and recovery.
View Metric →
Related Charts
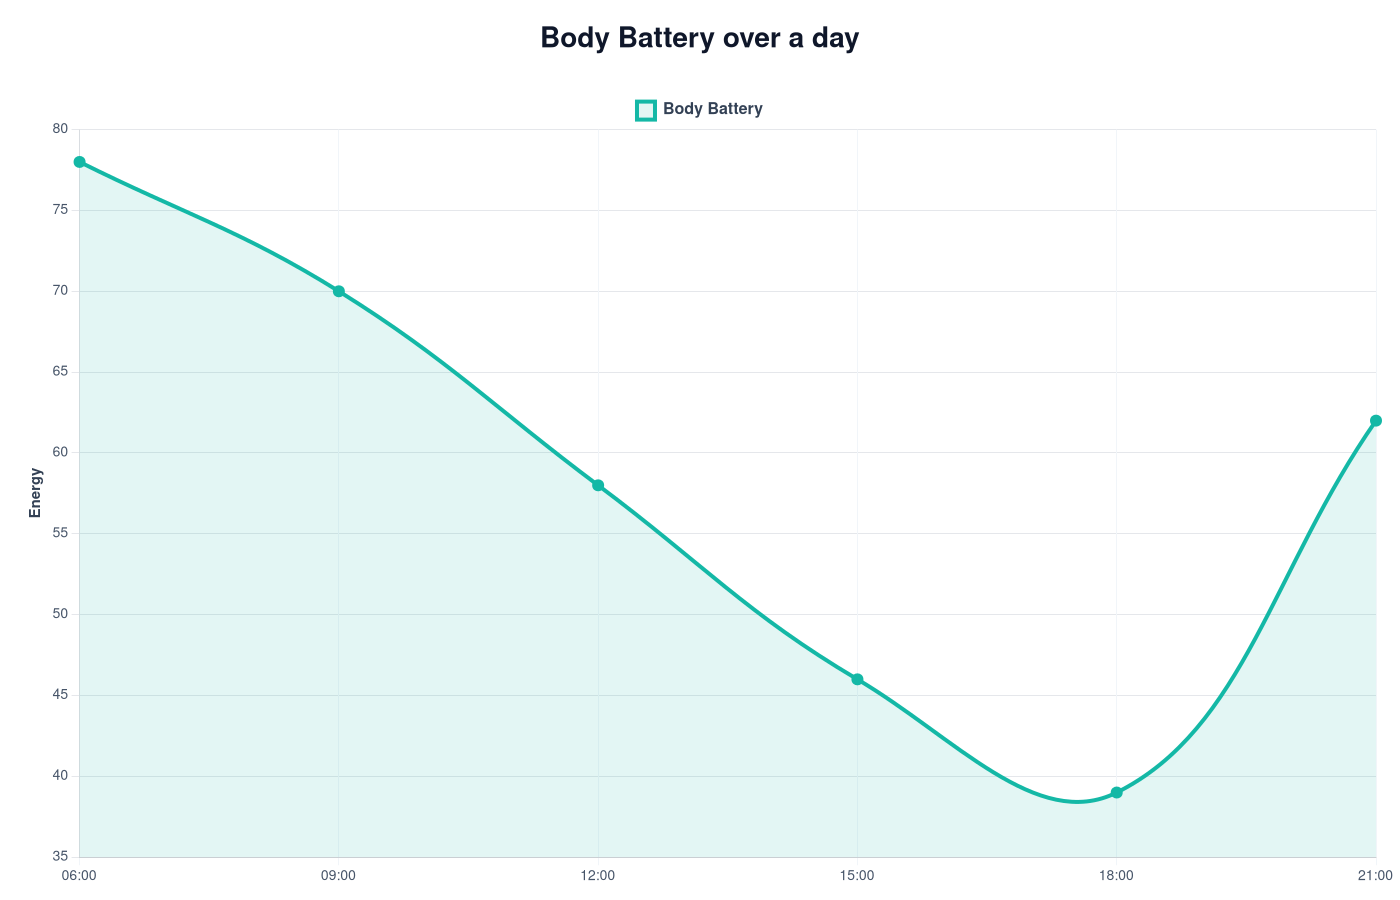
Body Battery Chart
Body Battery charts show how wearable devices estimate energy, recovery and stress patterns during the day.
View Chart →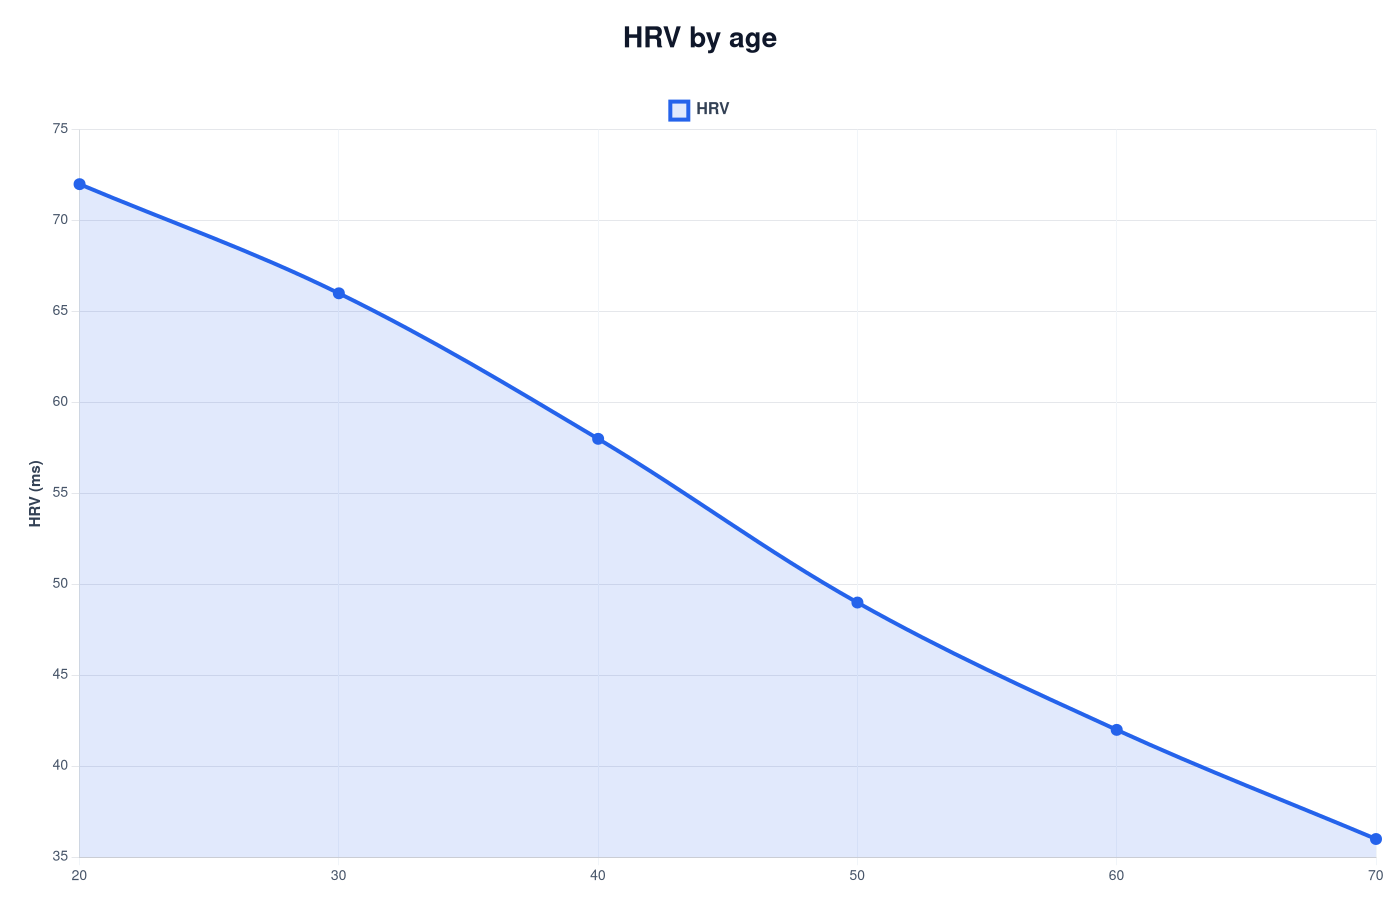
HRV Chart – Typical Heart Rate Variability Ranges
HRV trends show recovery and stress patterns over time.
View Chart →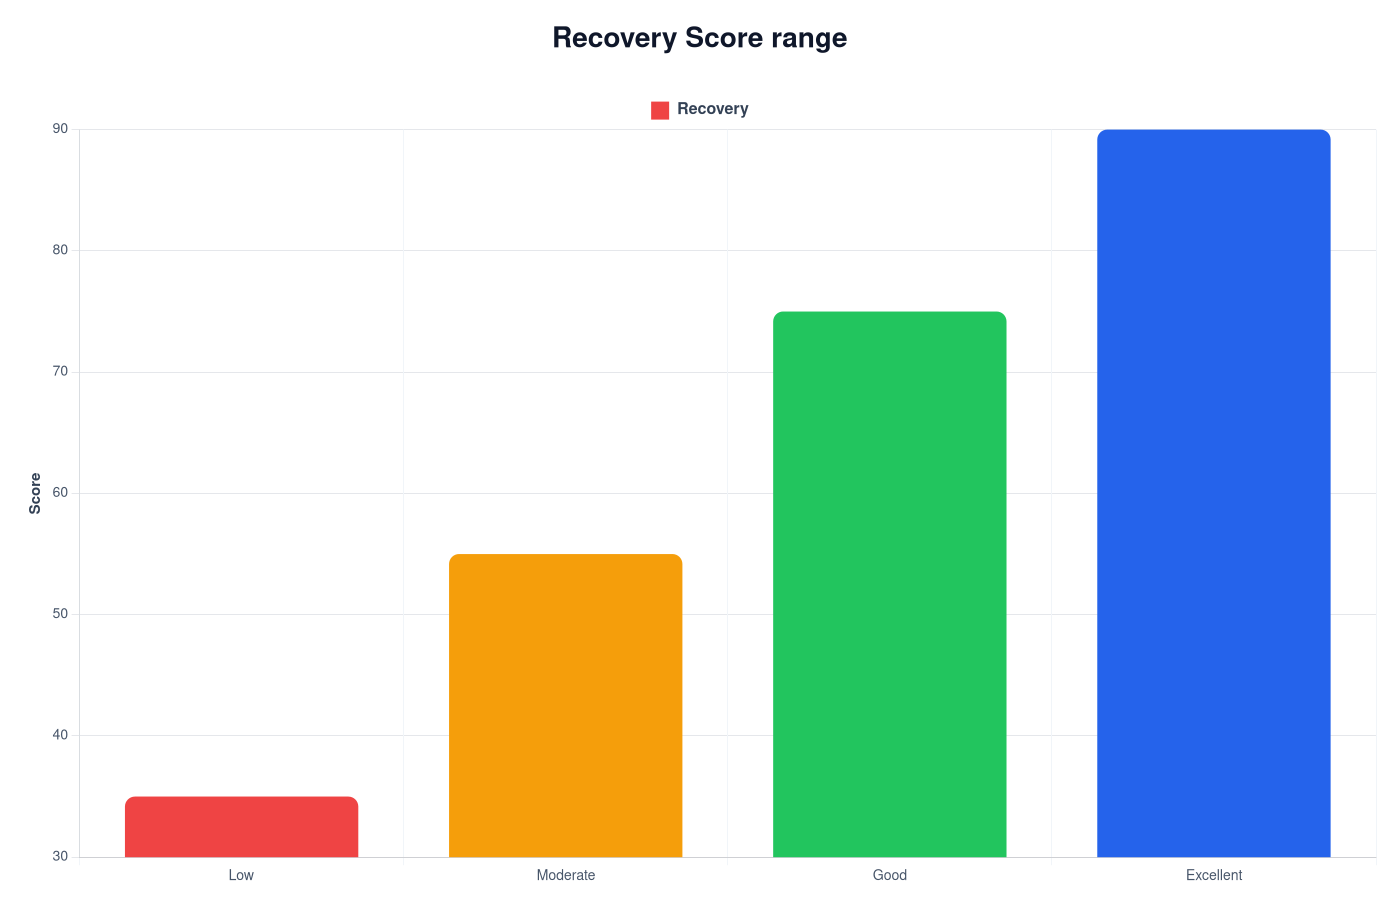
Recovery Score Chart
Recovery score charts show how wearables combine HRV, sleep and stress signals into one readiness value.
View Chart →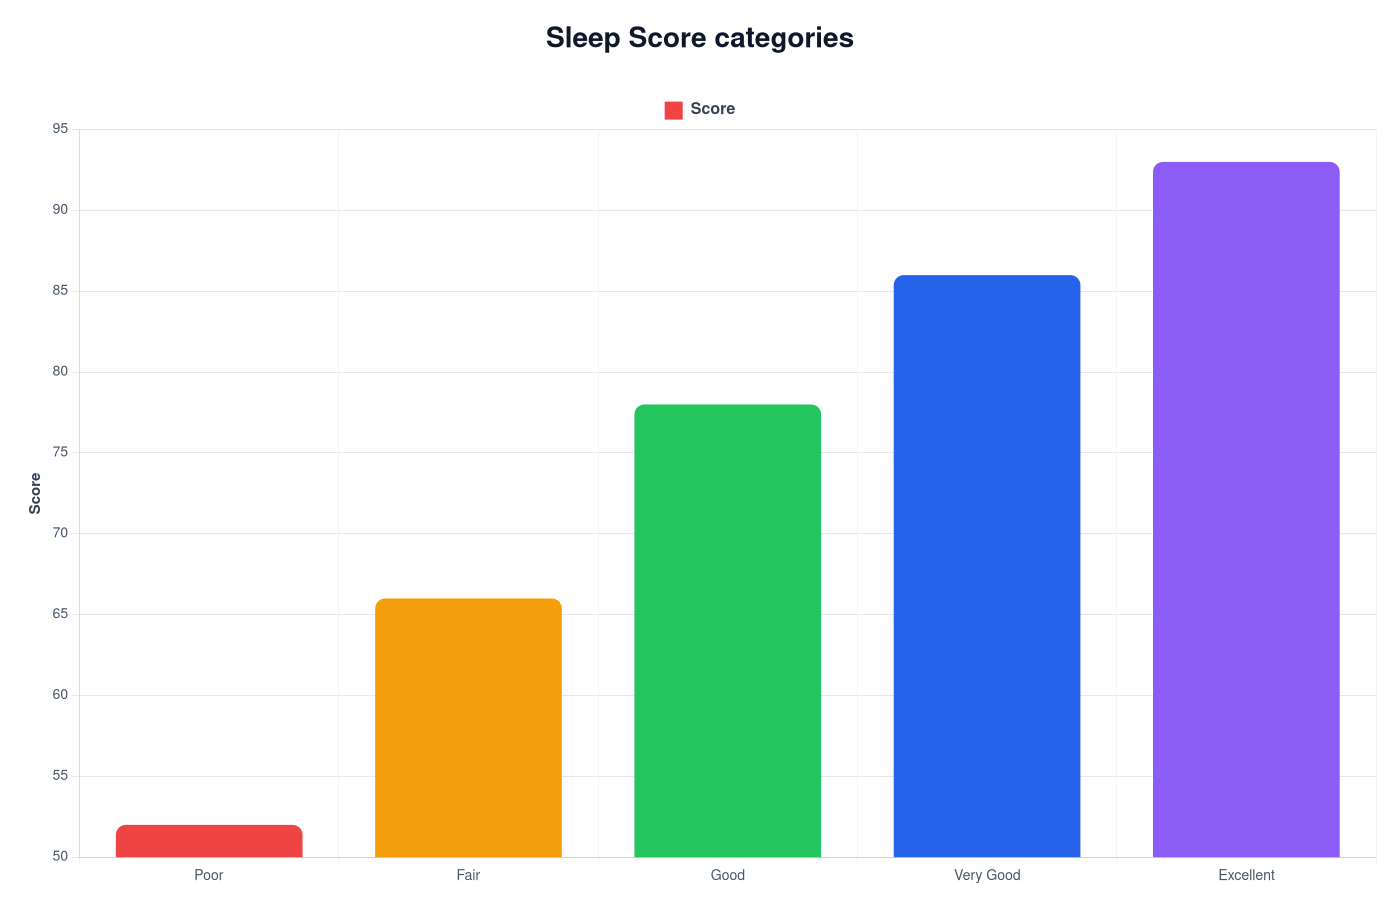
Sleep Score Chart – Sleep Quality Explained
Sleep score charts show typical score ranges and help interpret wearable sleep quality estimates.
View Chart →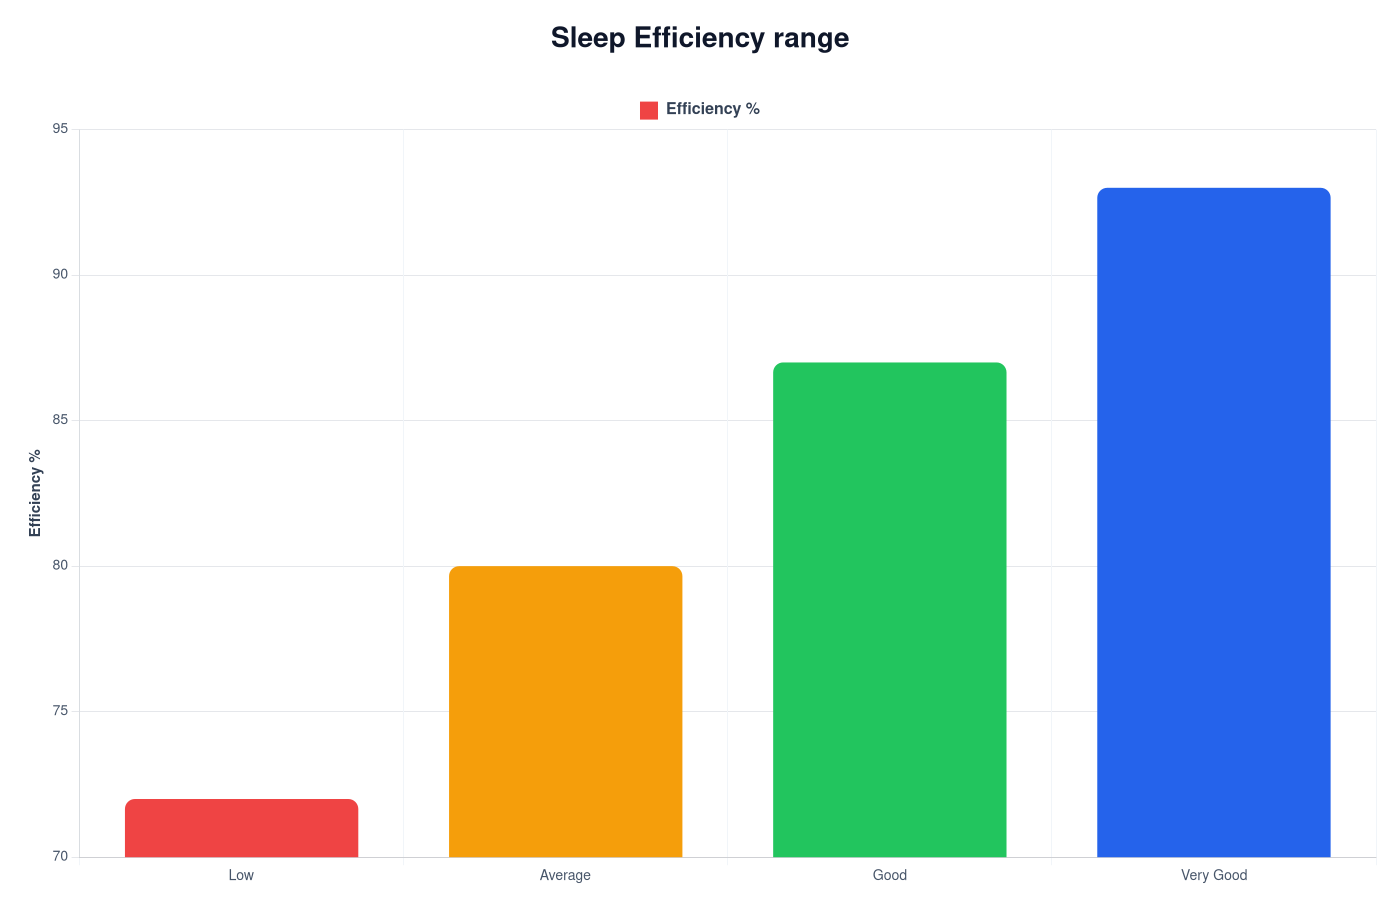
Sleep Efficiency Chart
Sleep efficiency charts show how much of your time in bed is spent sleeping and help interpret sleep continuity.
View Chart →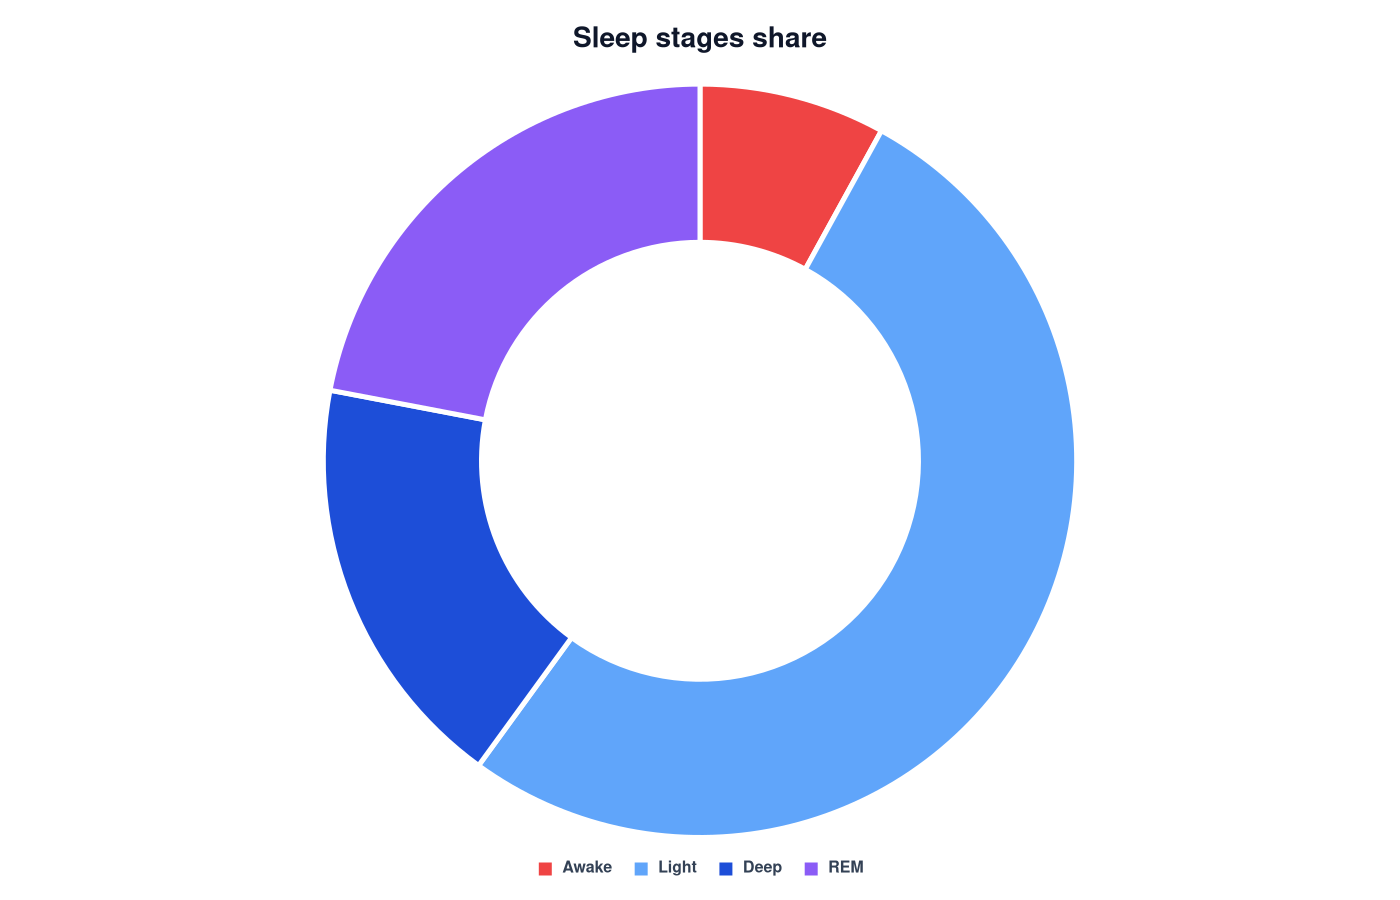
Sleep Stages Chart
Sleep stages charts show how sleep cycles are distributed between light sleep, deep sleep and REM sleep.
View Chart →